

QB Skill Addendum: Adjusted Net Yards Per Attempt
A rescaling of xEPA/Play to xANY/A, and a comparison of skill vs results for every QB in the post-merger era.

Welcome back to my Sports Passion Project everybody, where today I’m going to be putting an addendum onto the end of my QB skill article from a couple weeks ago. Instead of scaling the metric in EPA/Play terms, I’m instead going to scale it in ANY/A terms, mostly for the purpose comparing skills against results for all players across NFL history, instead of just 1999-2024, as I did in the original article.
A big additional benefit to this is also that ANY/A is perhaps a number that a lot of people can understand, even those who are not fluent in the language of EPA/Play like most of us here. I know pretty much everybody I’ve talked football with on the internet at least has a firm grasp on what a good ANY/A number is and is not, so this will open the door to a different level of understanding amongst those folks, hopefully.
For any questions as to how this model of QB skill was formulated, exactly how I came into the three skill-based measures that I chose to use for this, and any statistical nitpicks, please refer to the original article. It’s exceedingly likely that you will find your answer there. The purpose of this article is to use the exact same model, only rescaled to fit the boundaries of a different statistic.
As such, ordinally, in terms of rankings, every season is exactly the same when going from xEPA/Play to xANY/A, because the exact same mathematical model is used to fit the scale. If the relative rankings of QBs is all you care about, I’m not even sure if I can recommend reading further. xEPA already has everything you need.
However, this does come with the interesting statistical note that while I noted in the original article that these three skills (sack avoidance, passing accuracy, rushing value) can explain 70 percent of a player’s EPA/Play value, they can only explain about 60 percent of a player’s ANY/A value, meaning QBs are in significantly less individual control of their ANY/A results than their EPA/Play results.
One potential reason for this is that a specific quirk of the ANY/A statistic is that it does not know how to weight different types of QB mistakes very well.
In general, there are three types of mistakes a QB can make. Two are fairly individual. One is somewhat luck-based. The individual mistakes a QB can make is to take a sack, or to throw an incomplete pass. ANY/A specifically punishes both things in different ways, but the key point here is that the more luck-based type of mistake, turning the ball over, dwarfs both of them in terms of importance, according to ANY/A.
The important thing to understand whenever dealing with ANY/A is that this feature of way overvaluing turnover avoidance, in the modern era, is a kind of stylistic choice. Turnover avoidance does not dwarf the importance of sack or incompletion avoidance in real life in the way it does for an ANY/A calculation. Now that we have EPA for football (which did not exist when ANY/A was being conceived), we can see that avoiding a turnover is about 2.4 times more important than avoiding a sack, and about 3.4 times more important than avoiding an incompletion.
Contrast this with ANY/A’s formulation, which sees avoiding a turnover as roughly seven times more important than avoiding a sack, and you’ll truly see that ANY/A is a statistic that chooses to put a ton of weight on turnover avoidance. This is okay. It’s no crime for any statistic (or more likely, the person who created it) to like a certain type of player, but a lot like how rWAR really likes rangy defenders in baseball, seeing them as much more valuable than an average fan would, ANY/A really likes players who keep a good TD-INT ratio.
This is why modern players, who can finish with a career TD-INT ratio better than three to one, are so beloved by ANY/A compared to guys from the old days, who even in the best case scenario could not even dream of a TD-INT ratio as good as two to one. Roger Staubach finished with 153 TDs to 109 INTs, and this was the best QB of the immediate post-merger era.
Does this make Jimmy Garoppolo (who finished with a TD-INT ratio of 96 to 52, and therefore ANY/A likes him better) a better player than Roger Staubach? Of course not, but does it mean ANY/A as a statistic likes him more than Roger Staubach? Yes it does.
On that note, one final important thing to note is that ANY/A for the purpose of this model is calibrated according to the 2004-current NFL rules era. This is important to note because all skills for this analysis are scaled in terms of deviation from league average, except for rushing value, which has not significantly changed as the league has progressed in the same way everything else has (the top season for QB rushing value was in 1972, the same cannot be said for any other unadjusted value metric).
A 6.6 CPOE in 1970 is treated the same as a 6.6 CPOE in 2024 as a measure of QB skill, but as a measure of ANY/A results, they’re fundamentally different. A 6.6 CPOE in 1970 translated into a TD-INT ratio of 23 to ten for Sonny Jurgensen. A 6.8 CPOE in 2024 translated into a TD-INT ratio of 43 to nine for Joe Burrow. Joe Burrow is not significantly better in 2024 than Sonny Jurgensen in 1970, but the confines of what the league allowed a QB to do changed fundamentally between these two dates.
This is why, when fitting a metric like xANY/A, you must pick one era to fit it to. Elsewise, the metric will underrate all the old guys just like the real one does. I could have just as easily brought the modern players down to the level of the 1970s, but I thought it would be more informative for modern to look at the old guys through the lens of new numbers.
The interpretation is as follows. The average NFL Adjusted Net Yards per Attempt figure has changed radically through the years, so the number listed throughout this article is a player’s expected ANY/A, if they’d played their season in the 2004-current rules era.
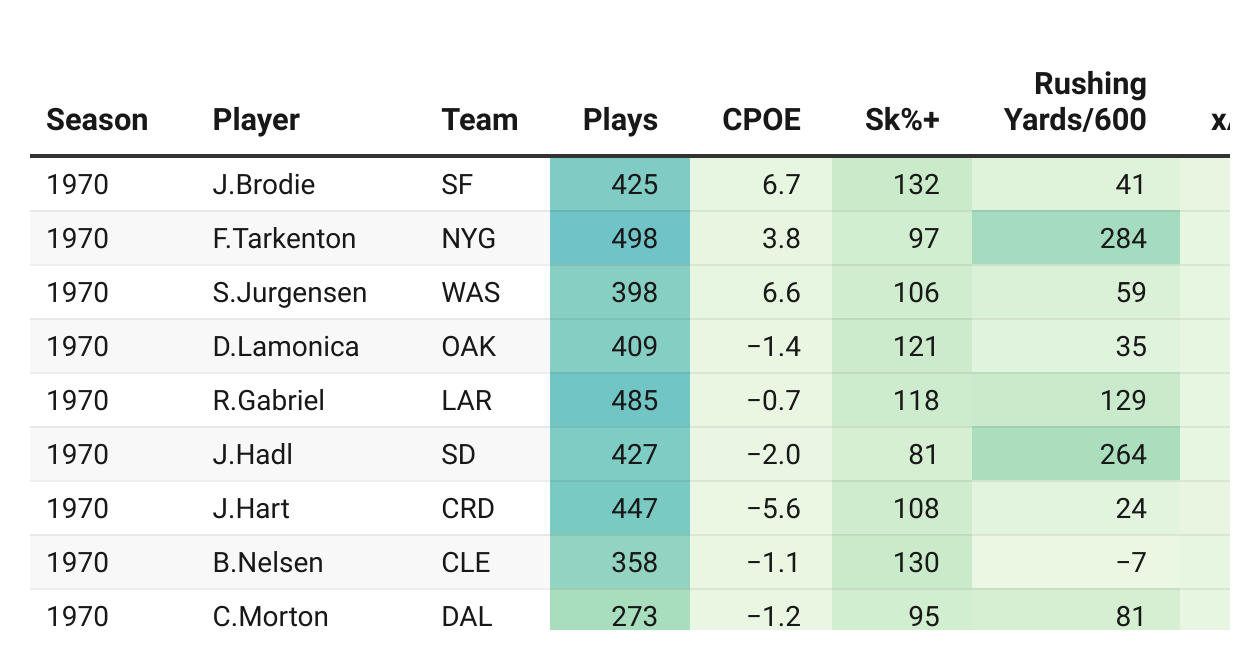
Okay. With that said, here is every qualifying QB season since 1970, featuring their fitted CPOE before 2006, measured CPOE from 2006 onwards, their sk%+, and their rushing yards per touch, scaled to 600 total touches, accompanied by the resulting xANY/A figure:
If you notice, when you sort players within their own season, the results are exactly the same as they were before under the xEPA/Play statistic. They’re only rescaled, but perhaps if you’re one of those who had trouble getting a grasp on what exactly Jim Everett having a 0.204 xEPA/Play in 1994 meant, maybe him having a 7.28 xANY/A in 1994 would mean something more to you, although I do understand the possible issue of interpretation stemming from the fact that I’m plucking that season out of its contemporary rules era and inserting it into a different one.
Nevertheless, this is the point of this table. Putting the same xEPA/Play values on a different scale, one that’s been around for a long time, and one that more people can understand.
I really have nothing further to say about this table, as I’ve already derived everything I wanted to derive from it in the original xEPA/Play article. The main purpose of this addendum comes in the following section, where we compare skills to results. When the metric is scaled using EPA/Play, you may only do this from 1999 onwards, but when the metric is scaled according to ANY/A, you may do it for all of post-merger NFL history.
This excites me a lot, because sophisticated analysis on who may or may not be under or overrated has not really been done, particularly for players who thrived before the 1983 QB draft changed the game. That brings forth the following table, featuring every player’s career xANY/A, contrasted with their actual career ANY/A. For players whose career began before the NFL-AFL merger in 1970, their career ANY/A from 1970 onwards is shown:
The ‘first season’ column is key here, because you can see the natural (and expected) conclusion that every QB that played in the 1970s is dramatically underrated by their actual results. This is obvious. It was always going to be the result, because if you remember the original xEPA/Play formulation, offensive environment intentionally was not accounted for, because it’s not something a QB can control.
Offensive environment can mean more than just the receiver room a QB is working with. In this case, players are being heavily dragged down by the general offensive environment of the entire NFL prior to the Mel Blount rule changes.
This table actually turns this xANY/A exercise into an unintentional attempt to quantify exactly how much QBs are hurt by the offensive environment of playing in the 1970s, before the rules were changed to make passing dramatically easier in 1978, and to expound further on that, I need to explain the three distinct eras of post-merger NFL passing.
There have been two distinct sweeping sets of rule changes, each designed to make passing the ball easier, in a fundamental way. These two sets of changes create a natural delineation of three distinct offensive environments in the post-merger NFL. The first goes from 1970 to 1977. In this era, if your ANY/A began with a five, you were a very good player. If it began with a six, you’d just had one of the best QB seasons in recent memory.
The NFL was not satisfied with this, so in 1978 changed the rules, lovingly dubbed the ‘Mel Blount rules.’ This is where they instituted the five yard contact rule, and various other changes designed to make throwing the ball fundamentally easier. This creates the NFL’s second era of offence, which lasts from 1978 to 2003. However, by the time this era ended, there had become an epidemic of grabbing and holding, making it extremely hard for receivers to get separation.
Therefore, in 2004, the NFL changed its rules again, making holding a receiver a more strictly enforced penalty, amongst various other changes designed to make throwing the ball even easier yet. This creates a third distinct era of NFL passing, which goes from 2004 to the present. This era contains within it a soft reboot in 2011, but the changes there are less fundamental, so I think it’s tenuously okay not to split things into four eras.
Considering this knowledge, I had the idea to compare players’ skills to their results within their own eras. While this does limit the ability for cross-era comparisons, cross-era comparisons are already radically difficult anyways. To me, I’m content to say that somebody is over or underrated by their results within their own offensive era.
In an effort to tell the story in a straightforward way, I’ll advance chronologically, beginning with the pre-Mel Blount rules offensive era from 1970-1977. This is every QB who played the majority of their career snaps before the rule changes in 1978, listed alongside their career xANY/A, and their career ANY/A.
Also, my apologies. I did not set the default sort correctly on any of these era tables. They’re all sorted by the order in which the respective QBs came into the league. Simply click on the ‘difference’ label to sort it manually by who is most over and underrated by their results. Thank you.
If you managed to correct my sorting mistake, you’ll see that Norm Snead is ridiculously underrated by his results, even within his own era, with an ANY/A figure coming in three full yards short of what his skills indicate it should’ve been if he played today. This indicates a player not just underrated by his results because he played in the 1970s. This indicates a player dramatically underrated by his results even in the 1970s.
Norm’s sk%+ from 1970 until retirement was 112. His fitted CPOE was 3.5, and while these top of the line peripherals did manifest into what remains the best QB season in post-merger New York Giants history, ranking third in ANY/A in 1972, this is the only time Norm actually got the results that his individual skill seems to indicate he should’ve been getting all along.
I get the sneaky feeling that his 89 INT%+ despite being one of the most accurate passers of his era has a lot to do with this, because we know that a quirk of the ANY/A stat is that it weighs interceptions much too heavily. I told you earlier the relative weight on different mistakes is very weighted in favour of avoiding INTs, and this kills a player like Norm Snead, who was great at avoiding sacks, but quite bad at avoiding INTs.
If we graded Norm’s mistakes by TEP (Turnover Equivalent Plays) instead, he would not grade out as an extremely mistake prone player. It’s not that the player is bad. It’s that this ANY/A statistic in particular has a blind spot that he sits in. It doesn’t like that Norm’s post-merger TD-INT ratio was 59 to 82.
Recall, this model was built on EPA/Play’s values. It knows that INTs are not that bad, but it’s rescaled to fit a statistic that thinks INTs are the worst thing in the world. ANY/A systematically underrates a player like Norm Snead, because of its imperfect understanding of how the game of football works, but xANY/A doesn’t. This is how you end up with such a grievous divergence.
I know it’s difficult to understand for modern fans that a player with a TD to INT ratio of 59 to 82 could have ever been considered good, but this was an era where Ken Stabler finished with 194 to 222 and made the Hall of Fame, deservingly so might I add. Throwing more INTs than TDs did not preclude you from being an elite QB in the 1970s in the way that it does today, but it always precluded you from being viewed as an elite player by ANY/A.
It’s a systematic misunderstanding of how football works, promulgated back through the entirety of history by the fact that ANY/A is the metric of choice to grade players in the eras before play tracking was possible and EPA/Play became widespread. It’s a good metric. That’s why I’m using it, but if you’re a player with a mediocre or worse TD-INT ratio, it will say you’re a bad player, whether you are one or not.
Mix this into the fact that Norm was mostly also stuck on bad teams, hence his 52-100-7 career record, and that’s why you haven’t heard the name Norm Snead very often in the 50 years since he retired, if ever, despite being the third best QB of his era by xANY/A.
Joining Norm in the grossly underrated category is Dennis Shaw, whom the model merely expects to be quite bad (17th-20th in a 26 team league), with his combination of 1.1 career CPOE, 77 sk%+, but pretty good rushing numbers. Instead, Dennis Shaw is one of the worst QBs in post-merger NFL history by ANY/A, because of the same turnover problems that Norm Snead has.
Looking to the middle of the chart, you can see the average 1970s QB is underrated by about 1.7 on his ANY/A figure. This is not hard and fast, and does not work in every case, but a loose rule of thumb is that you can add 1.7 to any ANY/A figure before 1978, in order to translate it into the modern era.
Moving to the bottom of the table, there is a fivesome of QBs who are all underrated a lot less by their results than their peers of the 1970s, all within one tenth of each other, in terms of ANY/A vs xANY/A differential. These five names are Roger Staubach, Craig Morton, Terry Bradshaw, Jim Hart, and Fran Tarkenton.
Four of these are easy to explain. We’ve got the three best teams of the decade represented in Staubach, Bradshaw, and Tarkenton. Staubach and Bradshaw both had access to Hall of Fame receivers for the majority of their tenures. Fran Tarkenton did not, but did have access to a cadre of Pro Bowlers at various times, and comes equipped with a style that naturally avoided turnovers like the plague, which ANY/A really likes.
Jim Hart did not get one of the best teams of the decade, but he did get the Air Coryell offence for most of it, which is basically the Shanahan offence of its day. The odd seed in here is Craig Morton, who bounced from team to team to team, without many of those teams being very good.
Of course, xANY/A does not see him differently than it sees Dennis Shaw. It’s an easy bar to clear those expected results, if a player comes into the right circumstances, and Craig Morton has more than one season of inexplicable turnover luck on his career. 1970, 1977, and 1978 in particular all stand out as being years that did not feel repeatable. He did repeat it three times, so who am I, but to me, a player with a career INT%+ of 99 producing three seasons of 117 (1970), 123 (1977), and 125 (1978) feels more like three isolated seasons of turnover luck than any kind of repeatable pattern.
I’m not necessarily calling Craig Morton overrated, but I am saying that his name is likely known by more people than it should be known by, based strictly on his individual abilities, largely predicated on some of the situations he found himself in.
That brings our discussion of the 1970s decade to a close, but moves us onto talking about the second era of NFL passing, which spans from 1978-2003. The following is the chart showcasing players who played the majority of their career plays in the post-1978 era. Once again, the default sort is broken. My apologies. Please sort using the ‘difference’ column.
Once you get this table sorted by difference, you see that the man whom last time we found to be the very most underrated by his EPA/Play results, Brian Griese, all the way down in 13th place, seeing what small apples the original analysis was in this regard. We’ve got lots more to talk about.
Moving to the top of the list, you see two MVPs in the top three spots. My model views the QB very most underrated by his actual ANY/A results between the years of 1978 and 2003 to be Brian Sipe, and I cannot disagree with that. If you simply average the finish on my yearly tier lists, Brian Sipe comes out as one of the 30 best QBs in NFL history, but does anybody remember him that way?
A lot of that is because his prime was in the odd holding pattern between 1978-1983, where passing was now possible due to the rule changes, but the 1983 guys (Elway, Marino, etc.) had not yet come in to rip the whole league open, but a lot of that is also because Brian Sipe was a great player, and deserving NFL MVP, whose name does not get mentioned enough these days. He does not meet the Roger Staubach criteria of eight qualified seasons, which currently stands as the absolute minimum for a Hall of Fame QB, so I can’t say he’s a Hall of Fame guy, but Brian Sipe is absolutely a Hall of Fame talent.
By the time Cleveland got him a better offensive roster, his prime was already winding down, but he did still have time left to grab that one MVP award in 1980, and I’m happy about that, but I’m burying the lead here. Brian Sipe is important, but he’s not the MVP that popped out at you from the top of this table. Nor is Richard Todd, who is another Dennis Shaw type ‘bad but not that bad’ kind of guy. No. I have to talk about the third name on this table, where I’m going to come out and say it.
This table is the reason Ken Anderson is not in the Hall of Fame.
Not my table. Nobody cares what I think, but the fact that Ken Anderson is so underrated by his results. That’s why he’s not in the Hall of Fame. If you sort this table by career xANY/A, you can see he’s fifth of this era, behind only Young, Montana, Marino, and Fouts, and ahead of several Hall of Famers. However, his real results are dragged down precipitously. Why is this?
He’s a man with no era.
The reason Ken Anderson is not in the Hall of Fame is that he played 48.8 percent of his snaps before the 1978 rules changes, and 51.2 percent of his career snaps after the 1978 rules changes. Because of this, he gets lumped in with the post-1978 guys on these tables, and in the memories of a lot of people, but he does not have the career numbers to compete with the post-1978 guys, because he spent almost exactly half of his career getting his numbers weighed down by the offensive environment of 1972-1977, which is nowhere near as friendly.
By the time Ken Anderson retired, he was not just the last of a dying breed. He was a walking fossil. Ken was elite in the offensive environment of 1973. The only other player to post a top ten ANY/A in that year and not be retired by the end of the 1970s was Ken Stabler, who served with Ken Anderson as the NFL’s two foremost members of the over the hill gang for a while, and while Stabler finally gave it up in 1984, Anderson did not retire all the way until 1986, meaning he was not eligible for Hall of Fame consideration until 1991, by which point the NFL’s league average was quickly creeping towards the 5.91 ANY/A that made Ken Anderson a top five QB in 1973.
This is the same thing that held Ken Stabler out of the Hall of Fame until 2016. It’s what’s holding Ken Anderson out as we speak. They eventually went back and rectified the problem with Stabler. I have faith they’ll rectify it with Anderson too, but any time now guys. Kenny’s not getting any younger.
Bobby Hebert is an interesting name to see near the top of the list. The man very most underrated by his results who did not touch a football a single time before 1978. He’s also the one whose poor results are the very most difficult to pin down. He does not have significant turnover issues, in the way that most do who are underrated by ANY/A, and he was a winner too, with a career record of 56-44, and that’s including that record being severely hindered by going a combined 7-18 in his last two years, so his struggles to convert skill into result never did seem to hurt his New Orleans Saints teams too much.
I’d like to challenge you to a game.
Most people watching football at the time Bobby played can rhyme off several members of the vaunted Dome Patrol Saints defence. Sam Mills is the most obvious. There are others that I bet you could name also, but can you name me one great receiver that played with Bobby Hebert?
I can, but there’s only one. It’s 1992 Eric Martin. There were some good years before that too, but the 1980s New Orleans Saints were not exactly known for their deeply layered offensive rosters, and it’s no coincidence at all that 1992 is the one time Bobby lived up to his xANY/A in a season. Steve Deberg, Kordell Stewart, and Tim Couch are all similar stories to this, which is also how they ended up near the top of this list.
If we sort the table the other way to talk about overrated players, we see two players with the absolutely unbelievable trait of their results being so high that they would be considered overrated if they put up their career results with the same residuals today, in 2025. God bless Joe Gibbs, because these two men are Jay Schroeder, and Doug Williams.
This further plays into my hypothesis that Jay Schroeder is the single most overrated QB in the history of the NFL. I have nothing against Jay Schroeder, but he simply couldn’t complete passes at an acceptable level, finishing with a career completion percentage of 50.8 long past the time it was acceptable to do that, and kept getting chance after chance to try to do it.
Doug Williams is a similar story. He never touched a football before the 1978 rule changes either, but his career completion percentage is an extremely ugly 49.5 percent. This would’ve given him a positive CPOE in the early 1970s, but when Doug came into the league, this could not cut it, but with the dreamlike offensive situations he got put into for most of his career, it did cut it.
I’m sorry Doug. You’re a pivotal figure in the history of this league, and because of that I’m actually quite happy that you substantially outplayed your skill level, but 49.5 percent completion percentage just doesn’t work. Not even when Doug played did this work, and while 5.43 ANY/A was not great even in Doug’s era, it was about middle of the road, out of a QB who could not reasonably be expected to be that good, with his shaky (at best) throwing accuracy.
I’m happy to see the name of Phil Simms pop up near the top of the overrated list, as no overrated QBs list is complete without him, as is sadly true with my all-time favourite QB Mark Brunell. Spending your whole prime playing with both Jimmy Smith and Keenan McCardell fixes a lot of issues, but his fall from grace was swift after 1999.
We can also look at the very middle of this table too, which shows that to adjust an ANY/A figure from this 1978-2003 era into the 2004-present era, a good general rule of thumb is to add 0.7 to it. Once again, it does not work in every case, but it’s a good catch-all to use when comparing old to new if you don’t wish to do further analysis on an old season.
Finally, that moves us into the table for the modern (2004-present) era. It’s once again sorted according to the year the player came into the league. Alex Smith is where he is because of Akili Smith coming into the league in 1999, but his row of information is correct, but please sort by the ‘difference’ column in any event.
Since all these players also played in the EPA/Play era, we’ve discussed a lot of these results before in the original article, including the fact that Bryce Young currently stands as the player in his era very most hindered by offensive environment, with Chad Pennington taking his place in that regard if we make the qualifying threshold slightly higher, for Herman Edwards reasons.
This table does give me the chance to talk about some unturned stones though. Kyle Boller, David Carr, and Joey Harrington all stand as interesting examples for the same reason. All three are in the worst ten QBs of this era that got to 1000 plays in terms of individual skill by xANY/A, but all three got results so bad that they’re still significantly underrated anyways.
By ANY/A, Kyle Boller is by far the worst player with at least 1000 touches to play a majority of those touches after the 2004 rules changes. For perspective, Bryce Young currently stands as the second worst, and is pulling away, so it’s going to get even worse for Kyle as we move forward. Like I always say, there is more than one way to be under or overrated, and Kyle Boller being expected by xANY/A to be the fifth worst QB of his era, but his actual results translating into him being by far the worst, is one way to accomplish that. Carr and Harrington do the same thing in a slightly less extreme way.
A much more prudent example is Vince Young, whom xANY/A expects to be an upper half of the NFL QB with his 6.05, but in such a short career, his 2007 season alone, featuring a 78 INT%+ despite a CPOE of positive two, weighs him down a lot. Throughout this entire QB skill process, it has begun to look more and more galling that Vince Young was allowed to fall out of the NFL with just 47 career starts. They were not bad starts at all. A rare rushing QB that could actually avoid sacks, somebody should’ve been able to put this skillset to some use, but nobody ever did.
I don’t think anybody ever calls Vince Young a bust, but he’s typically only one level above that, and I think he should be higher. He’s an underrated player, and as we move further down the list, we see all kinds of guys that I routinely call underrated on the first page, including Josh McCown, Mac Jones, David Garrard (higher career CPOE than Tom Brady, and no, I will never quit or tire of pointing that out), Daniel Jones, Geno Smith, and even Rex Grossman, just to give a shoutout to the people who read the article I wrote on him a little while ago.
This is all fairly standard stuff, but when we flip over to the overrated guys, I notice something very interesting. Judging it by EPA/Play, the top five was monopolised by Shanahan and McVay guys, but when we judge it by ANY/A, somebody else jumps in to be significantly overrated by his results.
We’ve all heard me talk enough about CJ Stroud. The longform posts are not the place for that kind of banter about a modern player, but strictly scientifically speaking, he’s one of the most overrated players of his entire era, in terms of ANY/A results. His career is not over yet, so I’m fairly sure his results will come down to be in line with his xANY/A in time, but if there are any Houston Texans fans out there, don’t expect this to continue. You guys don’t have a Shanahan or McVay like every single other person in the top six of the overrated list does, so I suspect results regression will come for CJ Stroud, perhaps even worse than it already has.
There are lots of active players all over the overrated side of this table. I suspect regression to the mean is still coming for a lot of them, so I’ll take rain checks on talking about a lot of them. I’ve talked about Aaron Rodgers and Tom Brady already, so that leaves the very most overrated player by his real results who has more than 2000 plays and is currently retired as being Andrew Luck, and how fitting is that?
Once again, this is not a bash on anybody session, but nobody can deny to me that this consistent overperforming of his demonstrated skill level, in conjunction with the hype that Andrew came into the league with, combined to cast a much larger shadow than Andrew Luck actually created at the NFL level.
xANY/A does not see there to be any difference between Andrew Luck (6.04 career) and Vince Young (6.05 career), and I don’t see there to be much difference either. Their career CPOE figures (-0.8 for Vince, -0.9 for Andrew) are identical. Sack rate favours Andrew, but rushing value favours Vince. They end up in almost exactly the same spot, from almost exactly the same draft position, and yet Vince Young is only one tier above a bust, and Andrew Luck, while definitely looked on as at least a moderate failure as a number one overall pick, is still seen as several tiers above Vince Young.
The reason for that is that Andrew quite handsomely overperformed his demonstrated skill level, due in no small part to spending his whole career with the elite TY Hilton, while Vince quite underperformed his, due in no small part to the fact that the best receiver Vince ever threw a pass to was named Justin Gage, and I bet you don’t know who Justin Gage is.
This is how fragile things can be at the NFL level. Give Vince Young TY Hilton to throw to. Give Andrew Luck Justin Gage to throw to. As a matter of fact, give either of them the Kyle Shanahan offence, and see how radically their results change.
I’ve just spent 30000 characters talking about overrated and underrated players throughout the course of the NFL’s history. I’ve created a canon for the future of my Sports Passion Project as to who is considered underrated, featuring guys like Norm Snead, Brian Sipe, Ken Anderson, Ken Stabler, Bobby Hebert, Brian Griese, Chad Pennington, Vince Young, and several others, not all of whom I found room to mention.
I also found time to be less positive about several players, including greats of the 70s that were less underrated than their peers in Fran Tarkenton, Roger Staubach, and Terry Bradshaw. Then we moved to some seriously overrated guys in Jay Schroeder and Doug Williams, plus others in a similar but slightly less extreme category like Phil Simms and Mark Brunell, and finally we moved to the modern era, where it seems to be an epidemic of players that play for certain coaches that end up on these most overrated lists.
Through all of this, I think the overarching message has to be how statistically unstable of a game football still is. I mean think about it. My model has Vince Young and Andrew Luck right on top of each other, as basically the exact same player. However, the variance in things other than individual skill that each man faced throughout their respective careers took them in wildly different directions. While neither of these men were ever going to be great NFL players, they both should’ve been in the top half of the league at their respective times, and while that’s essentially where Andrew Luck ended up, Vince Young never made it as far as he could have, because of the simple variance that comes inherent in playing this sport.
Even at the position with the very most control over the game, it must be accepted that QBs have very little control over the game. If they did, Vince Young and Andrew Luck would’ve ended up right on top of each other in terms of career results. Bobby Hebert would’ve got a chance to be paid real starting QB money. Ken Anderson would be in the Hall of Fame.
None of these things happened.
Football remains quite the game of randomness. For all my attempts to separate skills from results, nothing can take that roll of the dice out of this game.
After reflection, I think that’s what we all love about it.
Thanks so much for reading.
I always like UNADJUSTED yards per pass attempt. To me its the best stat. 7.6 or better is good. 8 or higher is great and Ryan Tannehill 2019 was GREAT leading league with a 9.1 or so. YAC is included as it means QB is hitting targets going running speed, he's executing most plays exactly as the route combinations were designed.
It punishes checkdown dink and dunkers who dont move chains. Backup QBs stay in the league by having high completion rates, awful YPA in the 6's. Also guys who sling deep incompletions get behind the chains and fail to keep the ball.
In general though it shows an exciting offense in one game. Two guys with 8 YPA and a close finish is a fun game to watch/rewatch.
Nothing too in depth, but, in the spirit of this publication, went through looking at some of the best ANY/A results seasons from some of the worst career xANY/A quarterbacks. Biggest differential I saw poking around, I was pleasantly surprised to see, already has a His Year article: 2007 Derek Anderson.
There are some other seasons with larger absolute differences to their career xANY/A, but most involve bad quarterbacks having around league average seasons, results-wise. The next best I found was 1987 Marc Wilson, who actually managed a top-ten ANY/A season. Even in that season, the skills model doesn't love him, but he got some good results in losing efforts anyway.
In terms of the reverse (worst ANY/A season from some of the best career xANY/A quarterbacks), there's the obvious "young QB struggles" (TB Steve Young) and "aging veterans that probably should have retired" (2015 Peyton Manning). But sandwiched right in the middle of Fran Tarkenton's career is the 1971 season that saw him manage just 3.90 ANY/A. Even accounting for era, this is a bad result, despite fairly good skills model numbers (4th in the league that season). His Int% is a bit higher than his career norms, but still below league average on a rate basis, and he only goes from 16th to 14th when you change to NY/A (taking out the effect of interceptions).