


Can A Simple Model Draft QBs Better Than the NFL?
Analyzing whether I can hit on QB draft picks at a comparable rate to the NFL, using only box score college football data.

Welcome back to my Sports Passion Project everybody, where this week, I’ve dug my teeth into a project. Today, I’m going to venture into a territory where only the most foolish of all data analysts allow themselves to go.
The NFL Draft.
There is no reason that I’ve decided to take on this specific project at this specific time, but in the past week, I suppose I have heard the phrase ‘eye test’ for the last time. I’ve had all that I can take with that phrase. I cannot take anymore. Today, I’ve set my mind to ruin the phrase ‘eye test’ forever, at least in my own mind, by drafting QBs just as well as the NFL does, without watching a single snap of football.
Those of you who know me know that I’m telling the truth on this. American college football is not aired where I live, other than perhaps some MACtion when a sports network desperately needs to fill some air time once baseball season is over. There are some games tape delayed, but nobody watches those, and other than that, a Canadian’s exposure to American college football is limited almost exclusively to the playoffs, and since we all know I hate unnecessarily big playoffs, I don’t watch those either. That makes me the perfect person to do this experiment. I know a lot about American college football, but I know it exclusively as numbers or words on a page. I do not watch these games. I couldn’t (except the playoffs or a couple of MAC games) even if I wanted to.
Most of you know that in recent months, I have invented a QB stat, called xEPA/Play, or in English, a very awkward sounding Expected Expected Points Added per Play, which I plan to leverage into making this model. xEPA/Play aims to isolate a QB from his offensive environment, and therefore separate his skill from his results. You can read the whole article below for a full primer and all-time leaderboards in this statistic in the NFL, but I will give a very brief description here.
Conditioning on the fact that a QB is touching the football, and did not hand it to a RB, a football play can end in one of three ways. Either a pass attempt, a sack, or a QB rushing attempt. In my opinion, this finite set of only three possible ways for a play to end means there are only three fundamental skills to playing the QB position. Avoiding a sack, throwing the football, and running with the football.
xEPA/Play strictly focuses on how good QBs are at these three core skills, and translates these skills to an EPA/Play scale, which can be roughly interpreted as the EPA/Play value a player would’ve had if every QB in the NFL had exactly the same level of luck, offensive supporting cast, and etcetera. For instance, Brock Purdy in the Kyle Shanahan offence generated 0.198 EPA/Play in 2024, but his xEPA/Play was only 0.142.
This makes sense. If we theoretically put every player in the NFL on a level playing field, this would almost certainly mean a downgrade in offensive environment for Brock, because he would not have the Shanahan offence (an environment I think we can all agree tends to boost QB results) anymore. The reverse applies for a player such as Kyler Murray, who posted a 0.188 xEPA/Play in 2024, but only 0.150 in the real metric, likely due to an offensive roster in Arizona that left a lot to be desired last year.
In a fundamental way, this is what xEPA/Play is designed to do. It’s an attempt to grade everybody on a level playing field.
What does this have to do with drafting college players?
When drafting a QB, an NFL team is looking to answer a very similar question to the one xEPA/Play is trying to answer: how will a player’s skillset translate to a fundamentally different offensive environment? Generally, in the entire collegiate career of a QB who ends up being drafted, the number of difficult games will be fewer than ten. In the average game, the offensive roster of a QB who ends up drafted will blow away almost every defensive roster they come across, making it very easy to put up elite results.
For example, more than halfway through the 2024 season, before the Indiana Hoosiers began running into some tougher opponents, Kurtis Rourke’s EPA/Play was better than 0.6.
In the NFL, there will never be a difference in quality between any offence and its leaguewide defensive opposition such that a QB can ever generate 0.6 EPA/Play for half a season, and this is the process that teams (and I) must weed through when trying to select a player at this position. Which players are products of their fantastic offensive environments, and perhaps a weak schedule, and what makes them different from those who have skillsets that translate to an NFL environment in which it is much more difficult to play offence?
To the NFL’s credit, the league does not have a history of going overboard in reacting to elite surface-level results. College football’s all-time leader in passing yards and passing touchdowns (Case Keenum) was not even drafted. In a 2008 draft where Colt Brennan was coming off one of the best results seasons of all time for a college QB, he was still drafted only 186th. The league did not overreact to his superb results.
This is true for so-called ‘power conference’ players as well. Like I said earlier, the B1G’s leader in EPA/Play in 2024 was Kurtis Rourke, and for being the best QB (in terms of college results) in the nation’s best conference, he was rewarded with only the 227th draft slot in the 2025 draft.
I will not accuse the NFL of overreacting to results, but I will perhaps accuse the NFL of overreacting to other things they believe make it more likely that a player’s results will translate from one offensive environment to another. Things like arm strength, height, and whatever they may hear in an interview. However, I can’t watch the games, and I can’t conduct interviews. Even if I may want to, I don’t have the luxury of overreacting to anything like that. All I have at my disposal is a player’s college skill, such as I can see it in the box score.
My challenge today is to take those skills exhibited in the box score at the college level, and leverage them into drafting QBs as well or better than the NFL as a whole does.
Models:
To do this, first I have to find measures of the three components of xEPA/Play. I have to find a measure of passing accuracy, of the ability to avoid a sack, and the ability to rush with the football.
Luckily, in terms of both college football and NFL football, rushing yards per 600 total touches is a perfectly adequate way to measure rushing ability. The denominator is total touches, in order to reflect the fact that running for a QB is a choice. In most circumstances, a rush is an alternative ending to a play that could’ve ended in a throw, so this variable incorporates both a player’s choice to rush, and productivity while doing so. Some would think it raises a problem that every sack in college football is considered a failed rush attempt, but it really doesn’t, because anybody who ends up with negative rushing yards in a season due to sacks being counted is not a very good rusher anyway.
The other two factors are much more difficult.
In the NFL version of the xEPA/Play model, I use Completion Percentage Over Expected (CPOE) and sack%+ (which adjusts sack rate to league average) as measures of the ability to throw and to avoid a sack. Unfortunately, neither of these statistics exist at the college level, but fortunately, I’ve already solved one of these problems.
It’s a bit of a sketchy fix, but I’ve already made a model to produce a fitted value for a player’s CPOE, based only upon things that can be seen in a box score. The specifics are below. It can predict an NFL player’s CPOE with 80 percent accuracy. In this circumstance, it’s almost certainly lower than that, because I’m fitting an NFL model to college data, but models of college football CPOE are private, include lots of opponent adjusting, and feature several other characteristics that I’m not necessarily a fan of.

Therefore, I’ve decided to use my own CPOE model in this formulation, with the slight caveat that every conference gets to use their own league average completion percentage in place of the league average completion percentage variable from the NFL model. This means at any point in college football, there are ten or more different expected passing accuracy levels that players are being compared to, depending on which conference they’re playing in, but I think this is important to balance out the conferences that are offensive in character, like the Sun Belt, which routinely produces crazily high CPOE values when compared only against the nationwide average completion percentage.
An important note that I will make here is that independent players will be considered to be part of the conference against which their team played the most regular season (meaning non-playoff, non-Bowl) games. For instance, Notre Dame QB Riley Leonard was recently selected in the 2025 draft, and for the purposes of this analysis, is treated as having been a member of the ACC. Zach Wilson playing for BYU in 2020 is treated as a member of the Sun Belt. Brady Quinn playing for Notre Dame in 2006 is treated as a member of the B1G, and etcetera.
In theory, the exact same process of conference adjusting should be done for sack rate, but this immediately ran into a problem. Sacks are such high rarity events that one player who is very bad at sack avoidance can skew an entire league’s average. This is especially true back in the days when conferences used to have just ten (perhaps even fewer) full-time starting QBs. Think of it in terms of sample size.
If there are ten QBs in a conference who each throw 300 passes in a season, that is a sample of 3000 passes. If the league average completion percentage began at 60%, and one player threw 20 incompletions in a row, that would only drop league average completion percentage to 59.6%. That’s nowhere near even a one percent change. One bad player cannot impact anything very much.
Now assume that a conference has that same 3000 total pass attempts, but a sack rate of six percent on average. This is about 190 sacks leaguewide on approximately 3190 total drop backs. However, if we replace one of these starting QBs with a QB with an 11.2% sack rate, like Will Levis had in his draft year, all of a sudden the sack rate for the whole league is now 6.5%. That’s almost a ten percent increase in leaguewide average sack rate, caused by one player who is extremely bad at sack avoidance. This would make all the other QBs in the 2022 SEC look artificially better, simply because they were in the same conference as Will Levis, and that doesn’t feel right to me.
This makes me uncomfortable with adjusting sack rate to a conference’s average in a college football context.
I then set about adjusting for the nationwide average instead, but realised quickly that this is pointless, as from 2004 (the first year of data that records sacks separately) to 2024, the nationwide average sack rate (to one decimal place) does not change. This is actually a blessing, as it means all I have to do is plug standard sack rate into the formula, and it will serve the same purpose as sk%+ in the xEPA/Play formula.
This gives us our three xEPA/Play components. A player’s CPOE value based upon their box score stats, fitted by my model designed for the NFL, a player’s unadjusted sack rate, and a player’s unadjusted amount of rushing yards per 600 touches, but we are not yet done modelling.
I was originally going to give each college player an xEPA/Play value, but that is also pointless, because all that would be done with it in my context would be to predict the likelihood of NFL success using it, so I’ve decided to cut out the middle man, and skip straight to using xEPA/Play’s components to predict NFL success. To do this, I’m going to need to define success in the NFL at the QB position, and I choose to do so in the following way.
To me, a QB draft pick is successful if the player selected ever becomes good. Good is subjective, but for the purposes of this analysis, I will define a ‘good’ QB as anybody who ever had a season of at least 300 plays, and 0.100 xEPA/Play or more. I call this the Matthew Stafford benchmark, as he was drafted first overall, and has exactly one career season of at least 300 plays and 0.100 xEPA/Play or better, but nobody seems to construe his being drafted first overall as a disappointment of a draft selection. Therefore, any QB who at any point in his career has a 300+ play, 0.1 xEPA/Play or better season for the purpose of this analysis will be considered successful. Any player who does not do this is considered unsuccessful.
This binary variable (successful or unsuccessful) will be used to fit a logistic regression model, to predict the probability of success of a player in the NFL based upon their xEPA/Play skill in their final college season, using the exact same process as the one that built xEPA/Play, interacting all three components with each other.
I decided to use only a player’s final season, instead of their entire collegiate career, because for many players, including a non-negligible amount of those who get drafted, their final season is their entire collegiate career. A notable recent example is Kenny Pickett, who started games in five different seasons at Pitt, but was elite in only one of those seasons, the final one, which alone propelled him into being drafted in the first round. To account for stories like this, I use only the player’s final season in this analysis.
Also, due to data availability issues, I have decided not to include FCS players in this analysis at all. This means my model cannot analyse Carson Wentz, Joe Flacco, or Ryan Fitzpatrick, the three non-FBS QBs in this 2004-2024 period to meet the Matthew Stafford benchmark. It also cannot account for FCS failures like Trey Lance. This analysis focuses wholly on the 222 players drafted into the NFL to play QB that played in the 2004-2024 FBS seasons, which corresponds to the 2005-2025 NFL drafts.
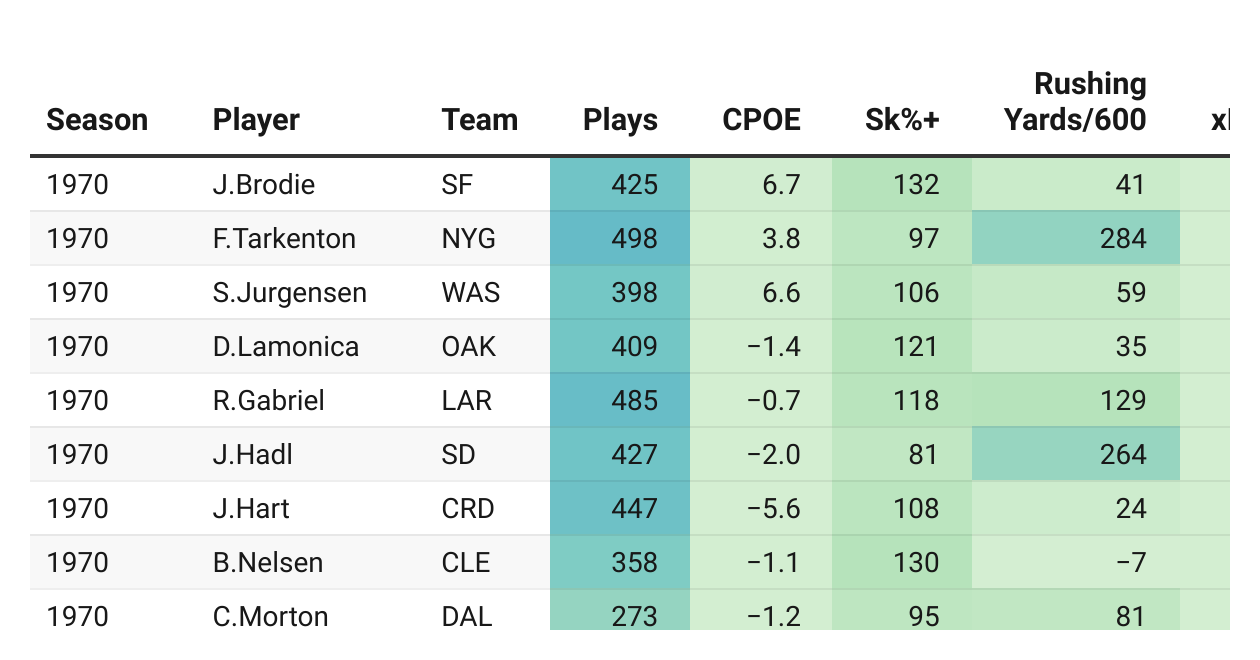
Without further ado, I’ll begin with the simplest specification, which predicts NFL success (will the player meet the benchmark or not?) based on college xEPA/Play, without any additional controls. Due to data sorting quirks, players are listed in two different ways. If a player ever qualified in an NFL season, his name is listed in my traditional first letter of first name [dot] entire last name format, as in ‘B.Nix,’ but players who never qualified in an NFL season are listed using their full name, as in ‘Dennis Dixon.’
Navigating this table will work the same as all tables on my Sports Passion Project. The default sort is the players my initial model thinks were most likely to succeed in the NFL coming out of college, but to look for a particular player, simply type his name in the search box, in the format specified above. To look for a particular college season, type that season into the search box, as in ‘2011’.
(PS. I understand the heat map does not work. I simply wanted a bit more colour on my table)
Beginning at the beginning, I think my initial model construing Jayden Daniels as by far the best QB prospect of the last 20 years is a good start in terms of using college xEPA/Play analysis to grade NFL suitability. It takes only a cursory look at the result to see that the way to make this model believe you’re going to be successful at the NFL level is to rush for a ton of yards, have an extremely high CPOE, and keep your sack rate at least in the ballpark of the nationwide average of six percent.
This is not just some statistical quirk. Think of it from a football perspective. Guys who can both run and throw at an elite level, even if they get sacked too much, are valuable commodities. Look at the guys near the top who fit the profile of better than 1000 rushing yards per 600, and a CPOE of five or better. It’s Jayden Daniels, Cam Newton, Jalen Hurts, Kyler Murray, and Vince Young.
I’m not sure how the NFL messed this up, not selecting Jalen Hurts until 53rd, because he’s statistically indistinguishable from the rest of this group, but Vince Young was drafted third, and met the Matthew Stafford benchmark twice, in both 2007 and 2009. Jayden Daniels was drafted second, and has met the Stafford benchmark already, and Cam and Kyler were both drafted first, going on to each beat the benchmark multiple times.
In general, this college archetype, a guy that gets sacked more than you would like, but throws with an insane amount of accuracy, and runs for better than 1000 yards per 600, translates to the NFL level, which is why my model likes this type of guy a lot. It is difficult to predict how a college prospect is going to translate to the NFL environment, but at least in the last 20 years, this type of player has been a lot easier to predict.
The only player in the last 20 years who has played college football in roughly this way, impressed the NFL enough to get drafted, but did not work out at the NFL level, is poor old Pat White, but you can see he’s not really the same. In addition to his injury luck, his CPOE of just 4.3 in his final season is not in the realm of the other guys in his archetype, although my model does still see him as one of the better QB prospects of the last 20 years, which is better than nothing.
Moving to other types of players, Bo Nix and Andy Dalton are the only two QBs to appear on the front page with college sack avoidance being the main draw. Through the years, it’s generally been acknowledged that sack avoidance tends to translate less to the NFL than other skills, so while it’s still a factor in the draft equation, it’s a small factor, relative to its importance once the player actually makes it to the NFL.
Andy Dalton is a good example of this. This model gives him exactly a 50% chance to become a good NFL player, which is very high, given how difficult QB prospects are to predict, largely on the back of his 2.47% sack rate for the Horned Frogs in 2010. To his credit, Andy Dalton did become a good NFL player, but it was not due to his sack avoidance. Instead, his best season (2015) featured him tearing up the NFL with a four flat CPOE, and only a 109 sk%+.
Andy’s pass accuracy in college was not bad, but the NFL takes only the best. His 7.2 CPOE in his final college season is one of the lowest to appear on the front page, and looks even worse than that considering he did not play in a power conference. Nevertheless, this is what makes the NFL draft fun, because Andy’s college accuracy translated from the Mountain West, even though Zach Wilson’s didn’t from the Sun Belt and Tim Tebow’s and Johnny Manziel’s didn’t from the SEC.
So far, I’ve been focusing only on the hits, but this model has some dire misses too. If you click the ‘Success Probability’ label, it reverses the sort, and we can see that there are no players that ever met the Stafford benchmark amongst the drafted players that my model deems amongst the least likely to succeed, but if you click once over to the second last page, you will find an absolute disaster.
According to my model, Josh Allen was only the 197th most likely to succeed amongst all drafted QBs since 2005, with only a six percent probability of success. Obviously, since Josh Allen is either one of the best ten QBs of all time already, or he’s getting really close to that, the NFL was right to pick him in the first round, and his college xEPA/Play was entirely unrepresentative of his future NFL success, but Josh Allen is one of very few players in football history ever to get better once placed into the NFL offensive environment.
In the 2017 college season, Josh posted a negative CPOE and a sack rate worse than the nationwide average in the non-power Mountain West conference, and did not provide much rushing value to compensate. If you would’ve told anybody back then that this guy would one day finish second in the NFL in CPOE, lead the NFL in sack avoidance, or even put up 763 rushing yards per 600 touches in an NFL season, you probably would’ve been laughed at on all three fronts individually, to say nothing about the likelihood of such a poor college player accomplishing all three of those things at the NFL level.
Did I mention that QBs are hard to predict?
Funnily enough, on the same page as Josh Allen, you will find Shedeur Sanders, whom my model gives just an eight percent chance of success at the NFL level. If you type ‘2024’ into the search box, you will see that this particular model feels it may have been a reach to draft Shedeur even in the fifth round, strictly based on what he did on the field, without any of the personality stuff, because it believes that a player with sack avoidance this poor, without any ability to rush to compensate, just cannot survive at the NFL level, regardless of what kind of arm comes with it.
Shedeur’s sack rate is in essence the same as Cam Newton’s in the 2010 season, but while Cam rushed for 1519 rushing yards per 600 to compensate for these sacks, Shedeur rushed for -50. That’s not good enough. My model believes these feet will sink the NFL career of an arm talent that’s absolutely good enough to play in the big leagues, because playing QB is not all about arm talent.
One more miss I will discuss is another bad one. It’s Patrick Mahomes, who is likely one of the best five QBs of all time already, but whom my model thought had just a 22 percent chance of succeeding at the NFL level, and ranked as the 86th best QB prospect of the last 20 years. Once again, the answer comes from the fact that Patrick is one of the very few people to ever get better when moving to the NFL’s offensive environment. Just like Josh Allen, his best NFL CPOE is better than his best college CPOE. His sack avoidance in the NFL is better than his best college season, and he rushes for more yards in the NFL too.
This is where my model struggles, in this form and also with all of its future augmentations. It fundamentally cannot predict a player to get better with the transition from college to the pros, because such a thing almosy never happens. For every one player like Josh Allen or Patrick Mahomes, where the NFL guesses the player is going to improve and guesses correctly, there are five Will Levises, Christian Hackenbergs, Blaine Gabberts, Jake Lockers, Josh Rosens. Five guys whose college stats cannot justify them being drafted so highly, and never make the projected improvement. That is the normal story. Mahomes and Allen are the outliers. The types of guys that make QB play so impossibly difficult to predict.
There is one more player I would like to talk about here, and if you noticed his name before, and wondered why I’ve been beating around the bush all this time, my apologies.
It’s Stefan Lefors.
Stefan was drafted in the fourth round of the 2005 NFL draft, and never took a snap at the NFL level, but my model sees him as the fourth best QB prospect of the last 20 years. How can this happen?
I can spell it with four letters.
CUSA.
The 2004 Louisville Cardinals were a real team. 2004 is the season that finally made it so clearly ridiculous that this school did not have power status that they were immediately snapped up into a power conference for 2005. They played a one possession game against Miami back when that used to really mean something, and went undefeated otherwise, finishing 11-1, and the reason for that is Stefan Lefors, with his 15.6 fitted CPOE, 3.38% sack rate, and solid rushing value to boot.
That CPOE is comparing against a slightly softer CUSA average, but it’s still absolutely absurd, especially coming with sack avoidance this good. In the modern day, where since Stefan fell all the way to the fourth round in 2005 there have been FCS players (an even lower of competition than CUSA) drafted in the top three multiple times, I believe he would’ve been drafted much higher, and we could see what he could’ve done at the NFL level. However, since we never got the chance to see for ourselves, he just has to go down as a massive what if. What if small conference guys were given chances in 2005? We may have missed out on a really good QB in Stefan Lefors.
Nevertheless, this does present a problem. Comparing statistics from the CUSA and other Group of Five conferences directly against stats accrued at Auburn and Oklahoma and other blue bloods creates the issue of differing perceptions. Therefore, the first augmentation to the model is to add a simple control, denoting whether or not the player in question was playing in a power conference, which I’ve denoted with a one for a power conference player, and 0 for a non-power player. Here are the results once such a control is added.
Wait a minute. You mean to tell me that both of the best two QB prospects of the last 20 years were each in the 2024 draft, and neither of them were selected first?
Such things happen when you bestow the number one pick upon such a QB inept organisation as the Chicago Bears. For a fun experiment, type ‘2023’ into the search box, and see where Caleb Williams ranks in an xEPA/Play sense relative to all of his QB peers in that draft.
Spoiler alert: it’s not pretty.
This slight change to the specification does not change the results very much. This is entirely fair, as I was not expecting it to, but the one thing that did throw me off is that adding this power conference control did not get rid of my Stefan Lefors problem. It did drop his estimated probability of success at the NFL level from 78% to 69%, but in terms of rank, he barely moved.
Because the model is built upon interaction terms, playing in a non-power conference can affect the probability of success of different types of players differently, and in this case, it’s primarily the rushing QBs in non-power conferences that do not translate. In the original specification, Chandler Harnish from Northern Illinois (2.7 CPOE, 2.78% sack rate, 1348 rushing yards per 600) was all the way up in 22nd, with a 46% estimated probability of success. In this new specification, he drops all the way to 64th, with just a 29% estimated probability of success.
In the specific case of Stefan Lefors, he barely drops at all, because playing in a non-power conference does not seem to change the rate at which passing accuracy translates from college to the NFL. Zach Wilson did not translate from the non-power Sun Belt, but amongst the other top non-power performers of the last 20 years, Colin Kaepernick, Alex Smith, and Andy Dalton all translated well to the pros.
To me, this is an indicator that playing in a power conference is slightly overrated as far as the NFL draft goes, but it heavily depends on the type of player. If you’re looking at a player from a non-power conference whose primary draw is his rushing ability, it might be wise to pass on that guy. If you’re looking at a player from a non-power conference whose appeal is wrapped up in his ability to throw the ball, it’s probably wise to pull the trigger. Zach Wilson did not work out, but Andy Dalton, Colin Kaepernick, and Alex Smith did, as far as reaching the Matthew Stafford benchmark as concerned.
This makes me wish even more that Stefan Lefors would’ve been allowed to take even a single snap at the NFL level. You never know how these things are going to work out, but with his 69%, even playing in the CUSA, he remains the biggest prospect according to my xEPA principles that did not pan out at the NFL level. He is right beside Dennis Dixon, but as we all know, Dennis’s final college season ended with a horrifying knee injury, and although he did get drafted, it was never the same Dennis Dixon after that. That’s a factor a model like this can’t account for.
As far as I can tell, there is no extenuating circumstance for Stefan Lefors. He was just never given a chance, seemingly for performance reasons. I will touch more on him a little bit later, but let’s look a little bit more around the updated chart.
A new appearance to the front page is Andrew Luck. With all the hype he had coming out of Stanford, I would’ve expected him to be a better xEPA player. With the new specification, he does jump over the 50 percent line, but this is very far from the sure thing he was perceived as at the time of the 2012 draft. He’s below such innocuous faces as Will Howard and Riley Leonard. Neither of those guys have played in the NFL yet, so we will see how much of an insult or compliment this is, but nevertheless, I think we can safely conclude that he was overhyped as a prospect, if skill on the football field is how we’re choosing to grade.
I understand why skill on the football field cannot be the only thing graded in real life, even though I’m artificially restricting myself to it here, because moving even higher with the new specification to eighth place is Johnny Football, who was legitimately a menace on the football field. I believe all the hype he got to be completely earned and deserved. He did flame out at the NFL level, but I believe that to be primarily for non-football reasons, as he’s the best player in terms of football skill that isn’t Stefan Lefors or Dennis Dixon to fail to work out in the NFL.
Also, for one final check in, we have to shield our eyes, as taking into account the fact he played in a non-power conference drops Josh Allen even further down the list, tricking the model into thinking he had just a three percent chance of success at the NFL level, the 13th worst draft prospect of the last 20 years. It is not fun to continue talking about how my model produces such a grizzly miss, so I’m going to move on.
One thing I would like to do with my model before moving onto yet another specification is to grade it. Take stock of how well I’m accomplishing my mission. Is this way of doing things already better than the NFL’s current process?
To do this, I am going to use the following framework. In the 20 drafts from 2004-2023, throwing out the FCS picks of Trey Lance, Carson Wentz, Joe Flacco, and a few other players that did not play their final college seasons, there have been 58 QBs drafted in the first round. Of these 58 players, 33 of them have met the Matthew Stafford benchmark. That’s a first round success rate of 56.9 percent, which is actually quite good in my opinion, given how hard such players are to predict, but how does it compare with my model?
To analyse this, I simply picked out the top 58 guys in terms of my predicted probability of success, throwing out the guys drafted in 2025, and counted how many of them eventually met the benchmark. For those of you who want to do this at home, this is down to Chandler Harnish on the embedded chart.
The verdict?
28.
This is actually comforting. As a football fan, it is good to know that I cannot draft QBs better than the entire NFL this easily, but I think this number is also what gives fans sitting on their couch such confidence that they can do it better than the clubs, because I am a fan sitting on my couch, and I’ve already gotten close to matching the ability of the clubs.
28 out of 58 is a 48.3 success rate, compared to the NFL’s 57.6. That’s a nine percent difference, but there are some hits that I managed that the real league did not. Some notable players this specification would’ve picked in the first round, that the league did not, are players like Jalen Hurts, Russell Wilson, Geno Smith, and Colin Kaepernick, but I must admit the league has got me on players like Josh Allen, Patrick Mahomes, Matt Ryan, and Jordan Love, all of whom I wouldn’t have gone anywhere near with a first rounder.
The league has got me still. However, my formula still clearly has some serious flaws if it is still interpreting Stefan Lefors to be one of the top QB prospects of his era. There must be another change I can make, and as it turns out, there is. It’s been staring me in the face this whole time.
Volume.
Of course, making a model entirely dependent on rate statistics ignores the reality that if players touch the ball more often, they tend to face tougher competition on average, because (in the case of a QB) the defence begins to sell out to stop the pass more. This means volume is not only good for volume’s sake. It’s also good to include in a model like this because it biases the rate statistics downwards, and look at how the results change when we control for it.
Look at who jumps onto the front page. We finally see a Patrick Mahomes appearance, as once we take into account his insane 784 play workload at Texas Tech, Patrick’s rate numbers look much more impressive. Even controlling for the fact that he touched the ball only 351 times in Louisville’s 2004 season still cannot get rid of Stefan Lefors, from the front page, but look at all the names surrounding him. To me, it makes his case more and more legitimate each time he stays on this front page with a specification change.
All of a sudden, Deshaun Watson begins looking like the most prized prospect the NFL has seen in a while, and it’s weird these days, with how everything has gone for Deshaun, to see his name beside all the greats of the game on the part of this table that he’s on. If not for some poor personal choices, he still could’ve been at this level.
A success probability of 85 percent makes it feel even more foolish that Jalen Hurts fell into the second round in the 2020 draft, and the same goes for Gardner Minshew, who should’ve been taken much higher than the sixth round in the 2019 draft. I think this chart also makes a good case for Brandon Weeden. It’s easy to look back at the Browns these days and ponder why a team would ever draft a 28 year old man with a first round draft choice, but he was a really good prospect at Oklahoma State.
There are still misses (no model based on football skill can ever be coerced into liking either Jordan Love or Josh Allen), but as far as predicting NFL success without doing anything except reading a box score, which is what this formula is designed to do, I’ll once again grade this formula against the NFL’s first round pick record.
Remember, the NFL’s success rate on first round pick QBs that are not FCS, and that played football in their final college season, is 33 out of 58. With this new specification, I have boosted mine to 31 out of 58, with the caveat that my top 58 has to include Dennis Dixon, because it is not built to be flexible enough to account for the injury, like the NFL was, and my top 58 also includes Mason Rudolph, who would’ve narrowed my deficit to 33-32 had he been given the chance to touch the ball just 21 more times in the 2024 season.
In short, I think I’ve finally gotten to the point of this article, because at this point, I have run out of things to control for. You can control for combine measurements (height, 40 time, etc.), which are technically just data, and wouldn’t breach what I’m trying to do here, but I strongly suspect there would be no correlation between combine measurements and success at this position.
I could just as easily adjust for quality of defensive opposition on this list, separate from whether or not a player plays in a power conference, but that’s an intensive process, because defensive opposition quality is not the same thing as strength of schedule quality, and if I were to do that, we are again getting away from the point. Box scores don’t adjust for opponent quality. I’m not trying to figure whether a data scientist can draft QBs better than NFL teams. I’m fairly confident they can. I am not a data scientist, and what I’m trying to figure out is whether I can do it using box score metrics that everybody in my audience can understand.
I think I’ve found my answer.
Can I draft as well as NFL teams do strictly by looking at college box scores? No, but can I get perilously close? More close than all these ridiculous ‘draft analysts’ would like me to?
Yes.
If we take the top 58 FBS QBs over the last 20 years (not including the 2025 draft) to be indicative of a first round calibre QB talent, the 58 QBs the NFL took in the first round in this period so far have been successful on 33 occasions. The 58 QBs I would’ve taken based on xEPA/Play principles were successful on 31 occasions, and we will see about the 32nd in Mason Rudolph.
That’s a difference of two out of 58, which makes the NFL 3.4% better than me at drafting the QB position, and if Mason Rudolph comes through at any point in the way I think he can, this becomes one out of 58 (1.7%). To use a bit of fancy stat talk, the NFL’s point estimate is higher, but they are not statistically significantly better at drafting the QB position than you or I, as long as we arrange the box score data in the right way, and this is without watching a single quarter of a single game.
I consider this point proven. For all the work and money and time that NFL teams put into answering the QB question, they can’t do it statistically significantly better than I can, and my country doesn’t even air American college football, but not to go out on a down note, let’s have some fun before I go.
For one more fun exercise, I will instate a cut off at the level of the QB my model thinks was the 58th most likely to succeed (not including the 2025 draft) in the last 20 years. That 58th player is Brock Purdy, who according to my principles would’ve been a first round draft pick, not a seventh round draft pick, but who had just a 28.3 percent chance of success according to my model.
Implicitly, the NFL has defined this level, or one very close to it, as the barometer of whether a QB is a first round pick or not. In the following section, I do a QB-only redraft, reordering the QBs in the first round for each year going back to 2005, according to where my model thinks they ought to be, and I look back with hindsight in order to decide whether my model or the real NFL handled the first round better.
Redrafting with xEPA/Play Principles:
2005: Real picks:
1) Alex Smith
24) Aaron Rodgers
25) Jason Campbell
Assuming the exact same teams had QB needs, these would be my picks:
1) Stefan Lefors
24) Alex Smith
In the opinion of my model, the 2005 draft only had two first round QBs in it, because it dislikes Aaron Rodgers for similar reasons that it dislikes Shedeur Sanders. Aaron Rodgers’ arm was elite, but most players with feet like his at the college level don’t survive in the NFL. Needless to say, replacing Aaron Rodgers with Stefan Lefors, and missing a QB in Jason Campbell who also broke the Matthew Stafford benchmark, makes 2005 a clear win for the real NFL. They drafted the QBs better than I did.
2006: Real picks:
3) Vince Young
10) Matt Leinart
11) Jay Cutler
My picks:
3) Vince Young
That’s right. By xEPA skill, this model does not view either Matt Leinart or Jay Cutler as first round prospects. This is a win on avoiding wasting a first rounder on Leinart, but the Denver version of Jay Cutler was a pretty good football player, so missing on him makes this is either a tie (offsetting Leinart) or perhaps a slight loss for me.
2007: Real Picks:
1) JaMarcus Russell
22) Brady Quinn
My picks:
N/A
Oh baby. Sometimes the nerds do get it right.
It’s a shame it comes so early, because this is probably my biggest win of the last 20 years. My box score xEPA model does not see there being any first round QB prospects at all in the 2007 NFL draft, and considering the two QBs selected in the first round were JaMarcus Russell and Brady Quinn, I construe avoiding both of them in the 2007 draft as a huge win for me.
2008: Real picks:
3) Matt Ryan
18) Joe Flacco
My picks:
Since I cannot say anything about FCS Joe Flacco, and he does end up breaking the Stafford benchmark in his career, I’m just going to assume he’s first round calibre.
3) Matt Ryan
18) Joe Flacco
Dennis Dixon
Erik Ainge
Once again, my model cannot account for the fact that Dennis’s knee exploded in his final college game. If I had any kind of manual override, I would use it on him. Erik Ainge from Tennessee is a similar story. My model likes him as a first round draft pick, but if it had the ability to know about his drug problems, it probably wouldn’t. As such, this is a loss for me, wasting first round picks on Dennis Dixon and Erik Ainge, but the loss is only technical.
2009: Real picks:
1) Matthew Stafford
5) Mark Sanchez
17) Josh Freeman
My picks:
1) Pat White
Ouch. The real NFL dummies me pretty hard on this one. My model does not see any of Matthew Stafford, Mark Sanchez or Josh Freeman as being worthy of a first round draft choice, but it does like Pat White. If we’re being realistic, he probably wouldn’t have gone first. It might be more reasonable to put him in the 17th spot in an otherwise QB bare first round instead, but still. Considering Matthew Stafford is the Matthew Stafford benchmark, and Josh Freeman is better than that, missing both of them makes this is another loss for me.
2010: Real picks:
1) Sam Bradford
25) Tim Tebow
My picks:
1) Colt McCoy
25) Mike Kafka
Tim Tebow
Sam Bradford
Dan LeFevour
The NFL and I tie on Tim Tebow and Sam Bradford. Unfortunately, I also lead my team off the cliff in wasting a first round pick on either Colt McCoy, Mike Kafka, or Dan LeFevour. Predicting QBs is hard. Another loss for me.
2011: Real picks:
1) Cam Newton
8) Jake Locker
10) Blaine Gabbert
12) Christian Ponder
My picks:
1) Cam Newton
8) Colin Kaepernick
10) Andy Dalton
Time for a comeback.
I’ve had a lot of losses in a row, and I know I said 2007 was a big win, but upon further reflection, this one might be even bigger. My model not only manages to avoid the disasters of Jake Locker, Blaine Gabbert, and Christian Ponder. It also manages to sniff out the NFL success of both Colin Kaepernick and Andy Dalton, and sees them as players that should’ve been picked in the first round. It probably picks them in the wrong order. I cannot be 100 percent perfect, but I definitely win 2011.
2012: Real picks:
1) Andrew Luck
2) Robert Griffin III
8) Ryan Tannehill
My picks:
1) Robert Griffin III
2) Brandon Weeden
8) Nick Foles
Chandler Harnish
Andrew Luck
Russell Wilson
Some positives. Some negatives.
My model does manage to sniff out that Andrew Luck is likely not a player you should be spending a first overall pick on, and that Robert Griffin III is. That’s a plus. It also manages to pick out that if you match career for career, you would likely take Nick Foles over Andrew Luck also, but it doesn’t drop Andrew all the way out of the first round, because he was still a good player. All of these are pluses. It’s also a plus to uncover both Nick Foles and Russell Wilson as first round talents.
Unfortunately, ranking Chandler Harnish over Andrew Luck is rough, and bringing six guys into the first round but still managing to miss the talents of both Kirk Cousins and Ryan Tannehill is rough also. In all, you could probably call 2012 a tie, if not a slight win for me.
2013: Real picks:
16) EJ Manuel
My picks:
16) Geno Smith
Ryan Nassib
EJ Manuel
Is this a win or a loss?
My model does manage to pick out that Geno Smith is by far the best QB in the 2013 NFL draft, but it also cannot manage to drop EJ Manuel out of the first round, and somehow brings Ryan Nassib along as another late first round player. This is another case like that of 2012. Drafting with xEPA principles does manage to pick out the best player in the class, but it also brings some guys into the late first round that probably don’t deserve to be there. Is this a win, or a loss? It’s tough to tell.
2014: Real picks:
3) Blake Bortles
22) Johnny Manziel
32) Teddy Bridgewater
My picks:
3) Johnny Manziel
22) Tajh Boyd
32) Teddy Bridgewater
Blake Bortles
Meh. I’ll call this a tie. My model did manage to decipher that Blake Bortles was nowhere near a third overall pick, but could not do the same with regards to Johnny Manziel, and didn’t even drop Blake out of the first round. Neither my model nor the NFL were able to pick out that Teddy Bridgewater is likely the best QB in this class, and neither my model nor the NFL were able to spot the talents of Derek Carr. I also really like Tajh Boyd, a player who in real life was cut in his first training camp and never spent a day on an NFL roster. This alone is not enough to make this not a tie. In 2014, the data and the NFL make the same mistakes.
2015: Real picks:
1) Jameis Winston
2) Marcus Mariota
My picks:
1) Marcus Mariota
2) Jameis Winston
Brett Hundley
I’ll call this a loss. The league and I quibble on the order of Winston and Mariota, but they’re both guys that broke the Stafford line anyway, so I’ll call that a tie, and my model elects to waste a first round pick on Brett Hundley, while the real league did not. That’s strictly worse for me.
2016: Real picks
1) Jared Goff
2) Carson Wentz
26) Paxton Lynch
Once again, Wentz is FCS. I can’t handle him with my model. Considering he’s a benchmark guy, I’ll keep him in my first round.
My picks:
1) Dak Prescott
2) Jared Goff
26) Carson Wentz
The only difference between my box score xEPA model and the real NFL is that my model was able to foresee the talents of Dak Prescott as the best QB in this class. That is no small thing. The 2016 draft is a big win for me.
2017: Real picks:
2) Mitchell Trubisky
10) Patrick Mahomes
12) Deshaun Watson
My picks:
2) Deshaun Watson
10) Patrick Mahomes
12) Josh Dobbs
Davis Webb
Mitchell Trubisky
I at least managed to make clear that Deshaun Watson and Patrick Mahomes are the top two in the 2017 class. Unfortunately, the model also happens to think that Mitch Trubisky should fall all the way below Josh Dobbs and Davis Webb, which is perhaps a bit extreme. I must gain some points for figuring out that Mitch is not a player that ought to be drafted second, but enough to overcome drafting Josh Dobbs and Davis Webb in round one? This is probably a small loss.
2018: Real picks:
1) Baker Mayfield
3) Sam Darnold
7) Josh Allen
10) Josh Rosen
32) Lamar Jackson
My picks:
1) Lamar Jackson
3) Baker Mayfield
7) Mason Rudolph
Hear me out. Missing Josh Allen is a serious hit to my stock in the 2018 draft, but I think I also deserve some credit for managing to figure out both a) that this draft is nowhere near as stacked as people thought it was, and b) that Lamar Jackson is clearly the best non-Josh Allen player here. I’m also claiming it as a positive that my model pulls Mason Rudolph into the first round, because I believe in his talents, should he ever be given a real chance to play.
Missing Sam Darnold does technically mean I’m missing one of the Stafford benchmark guys, but I don’t know if I’m too cut up about not spending a first round pick on him, and adding all of this together makes me want to claim a win. Steering away from both Josh Rosen and Sam Darnold, when combined, is probably still a plus, and I know missing Josh Allen is an almighty failure, but who was going to see what he’d become as a poor QB in a non-power conference?
I’ll call this a tie, because claiming a win when you miss Josh Allen is too ridiculous even for me, but there were a lot of good things about my 2018 draft.
2019: Real picks:
1) Kyler Murray
6) Daniel Jones
15) Dwayne Haskins
My picks:
1) Kyler Murray
6) Gardner Minshew
15) Dwayne Haskins
Ryan Finley
Daniel Jones is a lot like Sam Darnold. Missing him in this draft does mean I’m technically missing out on a guy that breaks the Stafford benchmark one time, but am I too cut up about it? Not really, especially because I replace him with another guy who technically gets to be called a success in the NFL, Gardner Minshew, who I pull all the way out of the sixth round. Using a first round pick on Ryan Finley out of NC State is not great, but I don’t think that alone is enough to make this not a tie.
2020: Real picks:
1) Joe Burrow
5) Tua Tagovailoa
6) Justin Herbert
26) Jordan Love
My picks:
1) Jalen Hurts
5) Joe Burrow
I have to give myself credit for pulling Jalen Hurts out of the second round, predicting that he’s going to clearly be the best QB in this class five years in, but there’s a lot of missed talent here. Justin Herbert is a lot like Sam Darnold or Daniel Jones. He has a season of 300+ plays and 0.100 xEPA/Play, but only one of them, so missing him doesn’t bother me too much, but missing both Tua Tagovailoa and Jordan Love?
Ouch.
Tua is another manual override situation, as the model got really spooked about his lack of volume at Alabama, but Jordan Love is a flat out miss. There’s nothing I can say in my own defence.
I’m willing to say that if this were a real draft situation, I would’ve overridden the model on Tua Tagovailoa, so this becomes whether you believe finding Jalen Hurts is worth it when you miss both Justin Herbert and Jordan Love. I believe that trade is worth it, but I know a lot of people don’t, so to be safe, I’m going to call the 2020 draft another tie between the NFL and myself.
2021: Real picks:
1) Trevor Lawrence
2) Zach Wilson
3) Trey Lance
11) Justin Fields
15) Mac Jones
Once again, we’re dealing with an FCS guy, although I’m going to suppose that my model would leave Trey Lance out because he’s a running guy, and remember, my model does not like running guys in non-power conferences.
My picks:
1) Mac Jones
2) Zach Wilson
3) Trevor Lawrence
We’ll see how this goes in the future, as Justin Fields still has potential, but right now, not using a first round pick on either Trey Lance or Justin Fields must be construed as a win for me. I would’ve loved not using a first round pick on Zach Wilson either, but he was really good at BYU. There is only so much foresight that is possible.
2022: Real picks:
20) Kenny Pickett
My picks:
20) Kenny Pickett
Matt Corral
Brock Purdy
The league and I tie on thinking Kenny Pickett is the best QB in this class pre-draft, so the only question as to whether I win this or not is whether the model thinking Matt Corral of Ole Miss is first round calibre is a big enough counterbalance to the fact that it believes pre-draft that Brock Purdy is a first round prospect. That is a good pull, from the final pick of the draft all the way to the first round, so it’s easy for me to say absolutely not. Matt Corral does not counterbalance Brock Purdy, especially because he has a bit of Dennis Dixon in him. I cannot control for the fact that he was carted off the field in his final college game. This could be another situation where I would’ve manually overridden the modal.
2023: Real picks:
1) Bryce Young
2) CJ Stroud
4) Anthony Richardson
My picks:
1) Dorian Thompson-Robinson
2) Stetson Bennett
My model does not see any of the three men actually selected in the first round as being first round prospects. However, it does see a first round prospect in both Dorian Thompson-Robinson and in Stetson Bennett. We will see about this, as the 2023 draft does not feature a QB who’s met the Matthew Stafford benchmark yet. Bryce Young has been the closest, but right now, all three of Young, Stroud, and Richardson remain in the territory where not using a first round pick on them is a plus for me. Considering I’ve used only two first round picks on bad QB play, while the real league used three, I have to sheepishly claim this as a win for myself.
2024: Real picks:
1) Caleb Williams
2) Jayden Daniels
3) Drake Maye
8) Michael Penix, Jr.
10) JJ McCarthy
12) Bo Nix
My picks:
1) Bo Nix
2) Jayden Daniels
3) Drake Maye
Just like 2023, a lot of this is speculative, but my model sees three first round prospects in the 2024 draft: Bo Nix, Jayden Daniels, and Drake Maye. One season in, that take is aging extremely well. If things continue as they’re going right now, this 2024 draft is going to be my biggest win of this entire 20 year time span. It’s only a guess as to whether affairs will continue this way or not, but right now, I have to say this is a win for myself.
2025: Real picks:
1) Cam Ward
25) Jaxson Dart
My picks:
1) Riley Leonard
25) Jaxson Dart
Kyle McCord
Will Howard
Dillon Gabriel
Cam Ward
I have ordered these guys how my model technically has them, but they can go in any order you want, because they are all right on top of each other. All within eight percentage points. All with a low first round grade. There are only so many draft picks between 24-32, but in my opinion, this 2025 draft is loaded to the top with six guys that all should’ve gone in approximately that area. One of them (Jaxson Dart) did go in that area. One of them (Cam Ward) was over drafted in my opinion, and the other four just had to wait for teams with a QB need to come around again, which is why Will Howard fell as low as the sixth round, despite college stats basically identical to Trevor Lawrence’s in his final year.
There are only so many QBs that can be good from one draft, but it’s close to a guarantee that at least one of these guys will work out. I don’t think it’s as likely as the football world thinks that the one who works out is going to be Cam Ward, because my model sees him as a late first rounder, just like all the rest of these guys. My model saw Brock Purdy, Alex Smith, and Jared Goff as late first round guys too. They worked out, but it also saw guys like Blake Bortles and EJ Manuel in this same area, and those guys did not show much at the NFL level. It’s liable that somebody from the 2025 draft is going to end up in each category. Your guess is as good as mine at the moment.
If we count up all the 20 drafts I just went over (not including 2025), I have claimed six outright losses. I have claimed the 2006 draft, which is in the grey area a tie and a loss, depending on how much you value not drafting Matt Leinart vs drafting Jay Cutler. I’ve claimed four ties. I’ve claimed two back to back drafts in 2012 and 2013 in the grey area between ties and small wins, and I’ve claimed seven outright wins, although a lot of those wins are in a string of four in a row between 2021-2024, subject to change.
I took care not to watch a single play of football during this entire process. The whole point of this project was to see how well you can draft the QB position without spending a single cent on the process, and without watching any football at all. We have again found the answer that you can do it just as well as the NFL can, if you put some elbow grease into it.
With this elbow grease, I was able to claim victory in seven draft processes, combined with the seven that sit as either a tie or close to a tie, and six outright losses. For safety, let’s say that either Bryce Young or CJ Stroud meets the Matthew Stafford standard at some point in their careers. At such point, my 2023 win instantly turns to a loss, giving me a losing 6-7-7 record. Even then, I think I’ve proved my point here. The league is not significantly better than me.
The NFL found Josh Allen and Jordan Love, and I didn’t, but I found Brock Purdy and Jalen Hurts, and they didn’t. All the while, my resource budget is $0, and my staff headcount is one. One guy who doesn’t just do data analysis. He also conceptualises the idea, makes the tables, and writes the writeup. Every NFL team employs multiples of people to try to answer the QB question, paying each of them who knows how much money, and they can barely do it better than I can.
For one final time, I’m just a guy in a basement in Canada. I cannot even watch American college football on my television. I do not know more about drafting QBs than the entire NFL, but when it gets right down to it, on their 58 FBS first round picks over the last 20 years, the league has hit on 33 of them. On my 58 FBS first round picks in the same span, I hit on 31, and there remains a possibility for Mason Rudolph to make that 32.
I understand that this is still a deficit, meaning the NFL as a whole is smarter than this one guy, but I’m close enough to them that when I reduced the sample to 20 draft processes, instead of 58 first round draft picks, I was able to one possession game luck my way to a 7-6-7 record against them.
To wrap all of this up, I believe that this analysis has proven conclusively that when anybody tells you that you must watch a QB play in college in order to ascertain how good he may be in the NFL, this is not correct. Compared to my preferred specification, their success rate of 33 out of 58 (56.9%) is only marginally higher than my 31 out of 58 (53.4%), and if I go back and grant myself the ability to push the big red button, overriding my model to account for Dennis Dixon’s and Matt Corral’s horrific leg injuries, plus Erik Ainge’s drug issues, in order to not draft any of these players in the first round, all of a sudden my success rate is creeping even closer to the NFL’s.
It’s a push and pull. I am not uniformly better or worse than the NFL. A strict data focus would’ve led to Aaron Rodgers falling clear out of the first round in 2005, but the eye test stopped that. That’s a win for the NFL, but the eye test (plus a bogus DUI charge) led to Dak Prescott being picked in the compensatory picks between the fourth and fifth round in the 2016 draft, whereas a strict data focus would’ve led to him being selected first overall. That’s a win for me.
There are many trades like this in the last 20 years, and once they all wash out, some guy in Canada named Robbie who writes a Substack publication, and now all of you who read it, are approximately as good at drafting the QB position as the NFL’s teams.
How about that for the eye test?
Thanks so much for reading.
The beginning of Bill James was caused by his skepticism about the way announcers and ex players and writers described and ranked players.
Zach Wilson might still have a chance to be successful. He spent the last year without the pressure of being the starting QB and with good coaches in Denver, and got to focus on just improving himself. Now he's in Miami, and if any backup is going to get playing time that's the spot. I really, really hope Tua can avoid more concussions, but if he does get another he'll be out for a while. It would be the most New York Jets story ever if Wilson does succeed in the AFC East... as a Miami Dolphin.